
Exploring the graph of r=asin(kΘ)+b.
When we vary a from -15 to 15 and keep k=1 and b=0 we get the following moving image:
To clarify what you are seeing, the below additional graphs are included for a=-8 and a=8. These are included to show that when a is positive, there are more ellipses formed to the right side of the y-axis. When a is negative there are more ellipses formed to the left of the y-axis.


When we vary b from -15 to 15 and keep a=1 and k=1 we get the following moving image:
To clarify what you are seeing, the below additional graphs are included for b=8. The graph for b=-8 was not included as the range was out of limit.

When we vary k from -15 to 15 and keep a=1 and b=0 we get the following moving image:
To clarify what you are seeing, the below additional graphs are included for k=-8 and k=8. These are included to show that when k is positive, there are more ellipses formed to the right side of the y-axis. When k is negative there are more ellipses formed to the left of the y-axis. This is the same trend that appears for a=-8 and a=8 too. There is a change in the scale of the graphs though.


Exploring the graph of r=acos(kΘ)+b.
When we vary a from -15 to 15 and keep k=1 abd b=0 we get the following moving image:
To clarify what you are seeing, the below additional graphs are included for a=-8 and a=8. These are included to show that when a is positive, there is an odd number of ellipses formed and when a is negative there is an even number of ellipses formed. Note that both graphs are symmetric about the y-axis.


When we vary b from -15 to 15 and keep a=1 and k=1 we get the following moving image:
To clarify what you are seeing, the below additional graphs are included for b=8. The graph for b=-8 was not included as the range was out of limit.

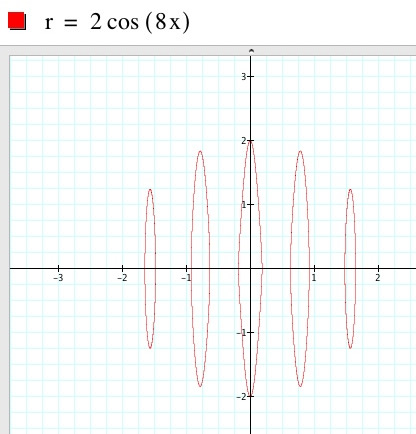
When we vary k from -15 to 15 and keep a=1 and b=0 we get the following moving image:
To clarify what you are seeing, the below additional graphs are included for k=-8 and k=8. Here the two graphs are the same and are similar to the graph above where a=8.

Exploring the graph of r=c/[acos(kΘ)+bsin(kΘ)]. Please click here to be directed to another page.